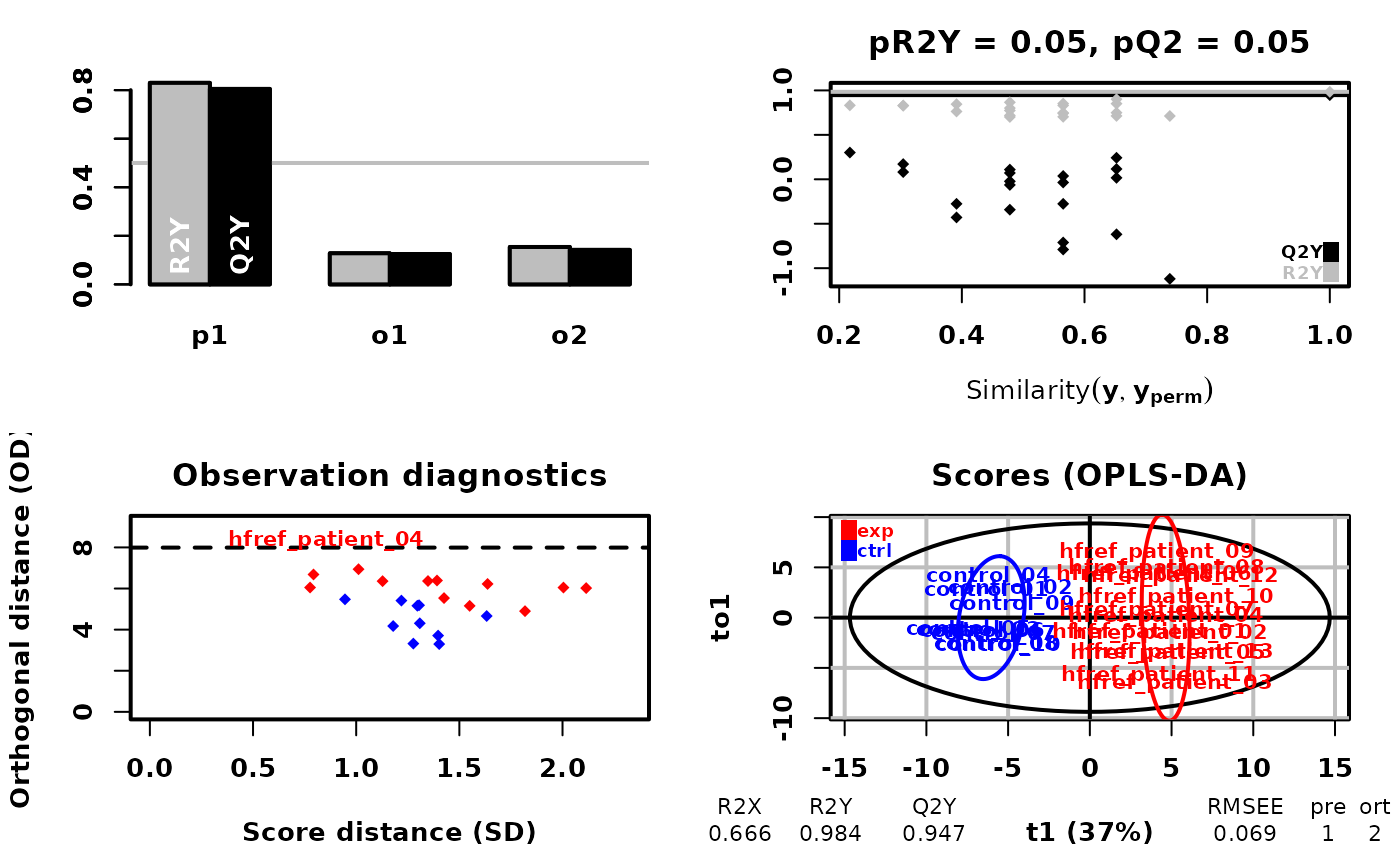
Orthogonal Partial Least Squares Discriminant Analysis (OPLS-DA) is a dimensionality reduction and classification method that extends PLS-DA by separating predictive variation (correlated to the response) from orthogonal variation (uncorrelated to the response). This improves model interpretability by isolating the variation related to class discrimination.
Usage
dr_oplsda(
  de_se,
  ncomp = 2,
  scaling = TRUE,
  clustering = "kmeans",
  cluster_num = 2,
  kmedoids_metric = NULL,
  distfun = NULL,
  hclustfun = NULL,
  eps = NULL,
  minPts = NULL
)
Arguments
- de_se
The resulting SummarizedExperiment object from the differential expression analysis function, such as
deSp_twoGroup,deSp_multiGroup,deChar_twoGroup, anddeChar_multiGroup.- ncomp
Numeric. The number of predictive components to include in the model. Default is
2. Note: OPLS-DA uses one predictive component by design (predI=1), and the number of orthogonal components is determined automatically by cross-validation (orthoI=NA).- scaling
Logical. If scaling=TRUE, each block is standardized to zero means and unit variances. Default is
TRUE.- clustering
Character. The method to be used for clustering. Allowed method include "kmeans", "kmedoids", "hclustering", "dbscan", "group_info". Default is
"kmeans". The option"group_info"is currently available only when the input is a SummarizedExperiment object resulting from differential expression analysis (e.g.,deSp_twoGroup(),deSp_multiGroup()); in this case, dimensionality reduction is performed based on the significant features and group information derived from the DE results.- cluster_num
Numeric. The interpretation of
cluster_numdepends on the value ofclustering:"group_info": A positive integer equal to the number of groups."kmeans"or"kmedoids": A positive integer between 2 and (number of samples - 1)."hclustering": A positive integer between 2 and the number of samples."dbscan": Should beNULL.
Default is
2.- kmedoids_metric
Character. The metric to be used for calculating dissimilarities between observations when choosing
"kmedoids"as clustering method. Must be one of "euclidean" and "manhattan". If "kmedoids" is not selected as the clustering method, set the value to NULL.- distfun
Character. The distance measure to be used when choosing
"hclustering"as clustering method. Allow method include "pearson", "kendall", "spearman", "euclidean", "manhattan", "maximum", "canberra", "binary", and "minkowski". If "hclustering" is not selected as the clustering method, set the value to NULL.- hclustfun
Character. The agglomeration method to be used when choosing
"hclustering"as clustering method. This should be (an unambiguous abbreviation of) one of "ward.D", "ward.D2", "single", "complete", "average" (=UPGMA), "mcquitty" (= WPGMA), "median" (= WPGMC), or "centroid" (= UPGMC). If "hclustering" is not selected as the clustering method, set the value to NULL.- eps
Numeric. The size of the epsilon neighborhood when choosing
"dbscan"as clustering method. If "dbscan" is not selected as the clustering method, set the value to NULL.- minPts
number of minimum points in the eps region (for core points) when choosing dbscan as clustering method.
Value
Return a list with 1 data frame, 1 interactive plot, and 1 static plot.
oplsda_result: A data frame of OPLS-DA data.
table_oplsda_loading: table for plotting OPLS-DA loading plot.
interacitve_oplsda & static_oplsda: OPLS-DA plot.
Examples
data("de_data_twoGroup")
processed_se <- data_process(
    de_data_twoGroup, exclude_missing=TRUE, exclude_missing_pct=70,
    replace_na_method='min', replace_na_method_ref=0.5,
    normalization='Percentage', transform='log10')
deSp_se <- deSp_twoGroup(processed_se, ref_group='ctrl', test='t-test',
    significant='pval', p_cutoff=0.05, FC_cutoff=1, transform='log10')
result_oplsda <- dr_oplsda(deSp_se, ncomp=2, scaling=TRUE,
    clustering='group_info', cluster_num=2, kmedoids_metric=NULL,
    distfun=NULL, hclustfun=NULL, eps=NULL, minPts=NULL)
#> OPLS-DA
#> 23 samples x 80 variables and 1 response
#> standard scaling of predictors and response(s)
#>       R2X(cum) R2Y(cum) Q2(cum)  RMSEE pre ort pR2Y  pQ2
#> Total    0.666    0.984   0.947 0.0693   1   2 0.05 0.05